The 2040 EU Climate Target: What does it mean for industrial carbon management?
On 6 February 2024, in line with the scientific advice by the European Scientific Advisory Board on Climate Change (ESABCC) and based on a detailed Impact Assessment, the European Commission presented a 90% net GHG emission reduction compared to 1990 levels as the recommended target for 2040 (link to the communication). The recommendation for 2040 emissions reduction target outlines the path to climate neutrality in 2050 as required under the European Climate Law.
In addition, it includes an impact assessment evaluating different emission reduction targets in accordance with an indicative greenhouse gas budget for the 2030–2050 period (link to the impact assessment). The objective of this Communication is to inform the preparation of the post-2030 framework. It does not propose new policy measures or set new sector-specific targets.
The 90% target is based on a thorough impact assessment that looked in detail at the implications of three target options for 2040:
- Option 1: a reduction of up to 80% compared to 1990, consistent with a linear trajectory between 2030 and 2050
- Option 2: a reduction of 85-90%, compatible with the level of net GHG reduction that would be reached if the current policy framework were extended to 2040 and
- Option 3: a reduction of 90-95%
Targets and objectives of the 2040 Target
A 90% emissions reduction is in line with the minimum recommendations of the ESABCC as well as the EU’s commitments under the Paris Agreement (link to the recommendations). Achieving this target will require several enabling conditions, such as the full implementation of the agreed 2030 framework.
Selected excerpts:
- “To deliver a reduction of net GHG emissions of 90%, the analysis in the impact assessment shows that the level of remaining EU GHG emissions in 2040 should be less than 850 MtCO2-eq1 and carbon removals (from the atmosphere through land- based and industrial carbon removals) should reach up to 400 MtCO2.”
- “In line with the international commitment to transition away from fossil fuels, policies should ensure that any remaining fossil fuel combustion will be coupled as soon as possible with carbon capture (utilisation) and storage.”
CCS/CCU/CDR
Selected excerpts:
- “All zero and low carbon energy solutions (including renewables, nuclear, energy efficiency, storage, CCS, CCU, carbon removals, geothermal and hydro-energy, and all other current and future net-zero energy technologies) are necessary to decarbonise the energy system by 2040.”
- A 90% target “is accompanied by faster investments for deployment of novel low carbon technologies such as hydrogen production by electrolysis, carbon capture and use and industrial carbon removals between 2031 and 2040”.
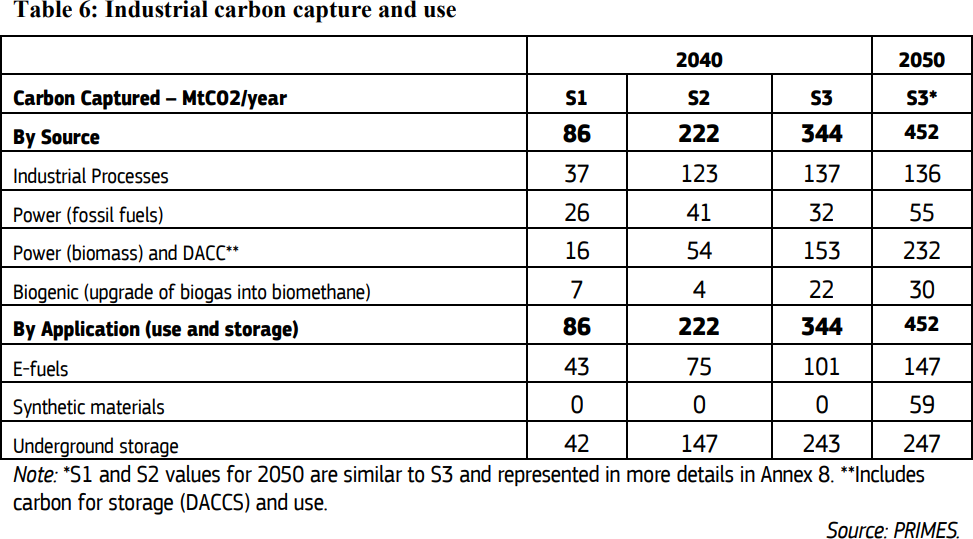
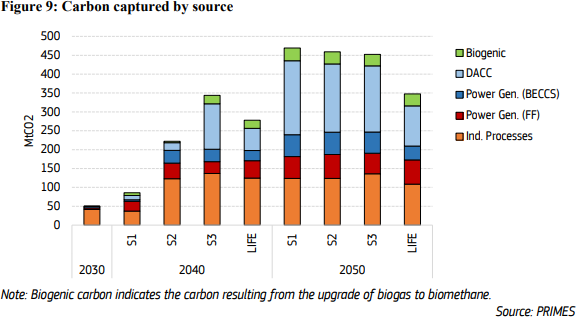
- “Industrial decarbonisation will also have to address “process emissions” not related to fuel combustion. For these, carbon capture2 can be a solution. The 2040 target entails an earlier deployment of carbon capture. Part of it will allow to generate industrial carbon removals which would complement land-based removals sequestering carbon in biomass and soils to contribute to the 90% reductions of net GHG emissions.”
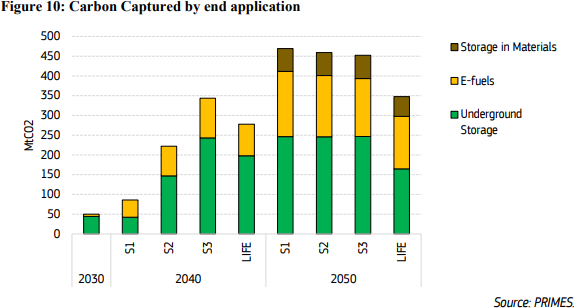
- “The development of CO2 value-chains through carbon capture and use (CCU), nature-friendly biobased materials, mechanical and chemical recycling can all boost the development of non-fossil feedstock to substitute fossil fuels in carbon-based products.”
- “The enhanced use of biomass residues and waste, advanced biofuels, BECCS technologies, and biobased products should be accompanied with clear rules that promote sustainability and consider the impacts on the size of the natural carbon sink in the LULUCF sector.”
- “The Communication on Industrial Carbon Management outlines a roadmap to deploy the necessary CCS and CCU technologies for hard-to-abate sectors, stressing the need for a regulatory framework in areas such as injection and transport of CO2, as a precondition to create a single market for CO2.”
Financing
Selected excerpts:
- “Energy system investment needs amount to close to €660 billion (equivalent to 3.2% of GDP) per annum on average over the entire period (against €250 billion over 2011-2020, or 1.7% of GDP, a decade with relatively low investments in the energy system), and yearly spendings in transport3 to about €870 billion (equivalent to 4.2% of GDP, a similar proportion of GDP as in 2011-2020). Option 3 brings some energy system investments forward to the 2030s, with an average annual investment of €710 billion over 2031-2040.”
- “The resulting energy system costs4 are also similar across options, ranging from 12.4% (Option 1), 12.7% (Option 2) to 12.9% of GDP (Option 3) in 2031-2040, a moderate increase compared to the 11.9% of GDP spent in 2011-2020, and then fall to about 11.3% for 2041-2050. The cost of fossil fuel imports decreases significantly under Option 3, to less than 1.4% of GDP by 2040 and less than 0.6% in the last decade (against 2.3% over 2010-2021 and 4.1% in 2022 during the recent energy crisis), saving about €2.8 trillion over 2031-2050.”
- “Public sector support and direct investment should be strategically deployed, also by frontloading and maximising existing resources with large-scale pooling of funding, making it accessible in the fastest and simplest way possible and
facilitating synergies between different instruments.”
3 Investments in the transport sector reflect the expenditures on vehicles, rolling stock, aircraft and vessels plus recharging and refuelling infrastructure. They do not cover investments in infrastructure to support multimodal mobility and sustainable urban transport. In particular, the acquisition costs of private vehicles represent about 60% of the total
4 The energy system cost is broader than the investments and consists of the capital cost (annualised investment cost) and the energy expenditures for economic activities. See the impact assessment for more details.
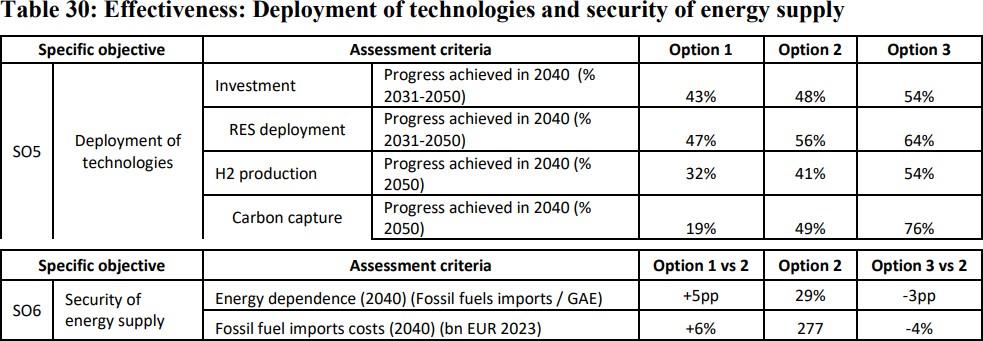
Tables
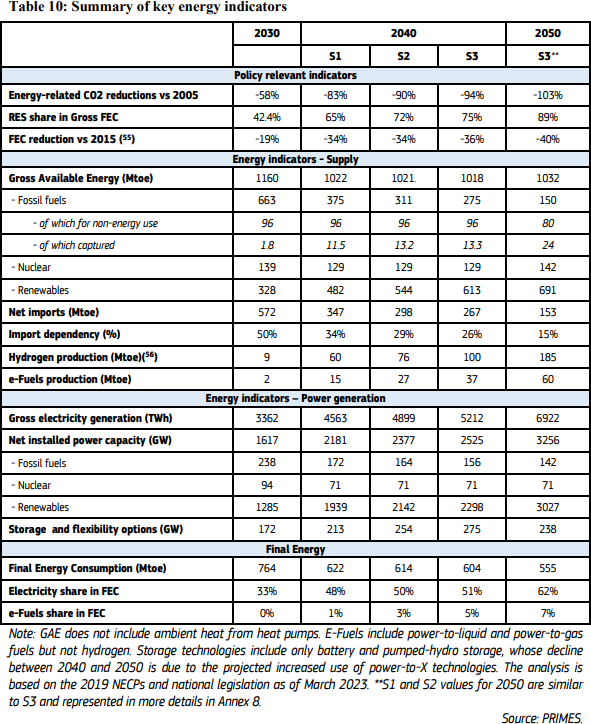
The tables below provide additional indications into the role of carbon capture: